googleVis(구글 비즈)
구글 비즈는 google에서 지원하는 다양한 그래프이다.
R 보다 보기 좋고, 움직이는 그래프를 그릴 수 있다.
웹 형태로 그래프 제공
install.packages("googleVis")
library(googleVis)
data(Fruits)
data(Exports)
require(datasets)
states<-data.frame(state.name, state.x77) # state.name, state.x77
data(CityPopularity)
data(Andrew)
require(stats)
data(quakes)
quakes$latlong<-paste(quakes$lat, quakes$long, sep=":")
gvisMotionChart
많은 최신 브라우저들은 지원하지 않는 Flash Charts 기능을 요구한다.
plotly::ggplotly 대체로 사용할 것
M1<-gvisMotionChart(Fruits, idvar="Fruit", timevar="Year")
plot(M1)
gvisGeoChart
지도 위에 데이터 표시하는데 사용(지오 코딩)
gvisGeoChart(data, locationvar=“”, colorvar=“”, sizevar=“”, hovervar=“”, options=list(), chartid)locationvar
Format1: “latitude:longitude”
Format2: Address, contry name, region name locations, or US metropolitan codes
options=list(
displayMode=
regions
markers
text
)
region code
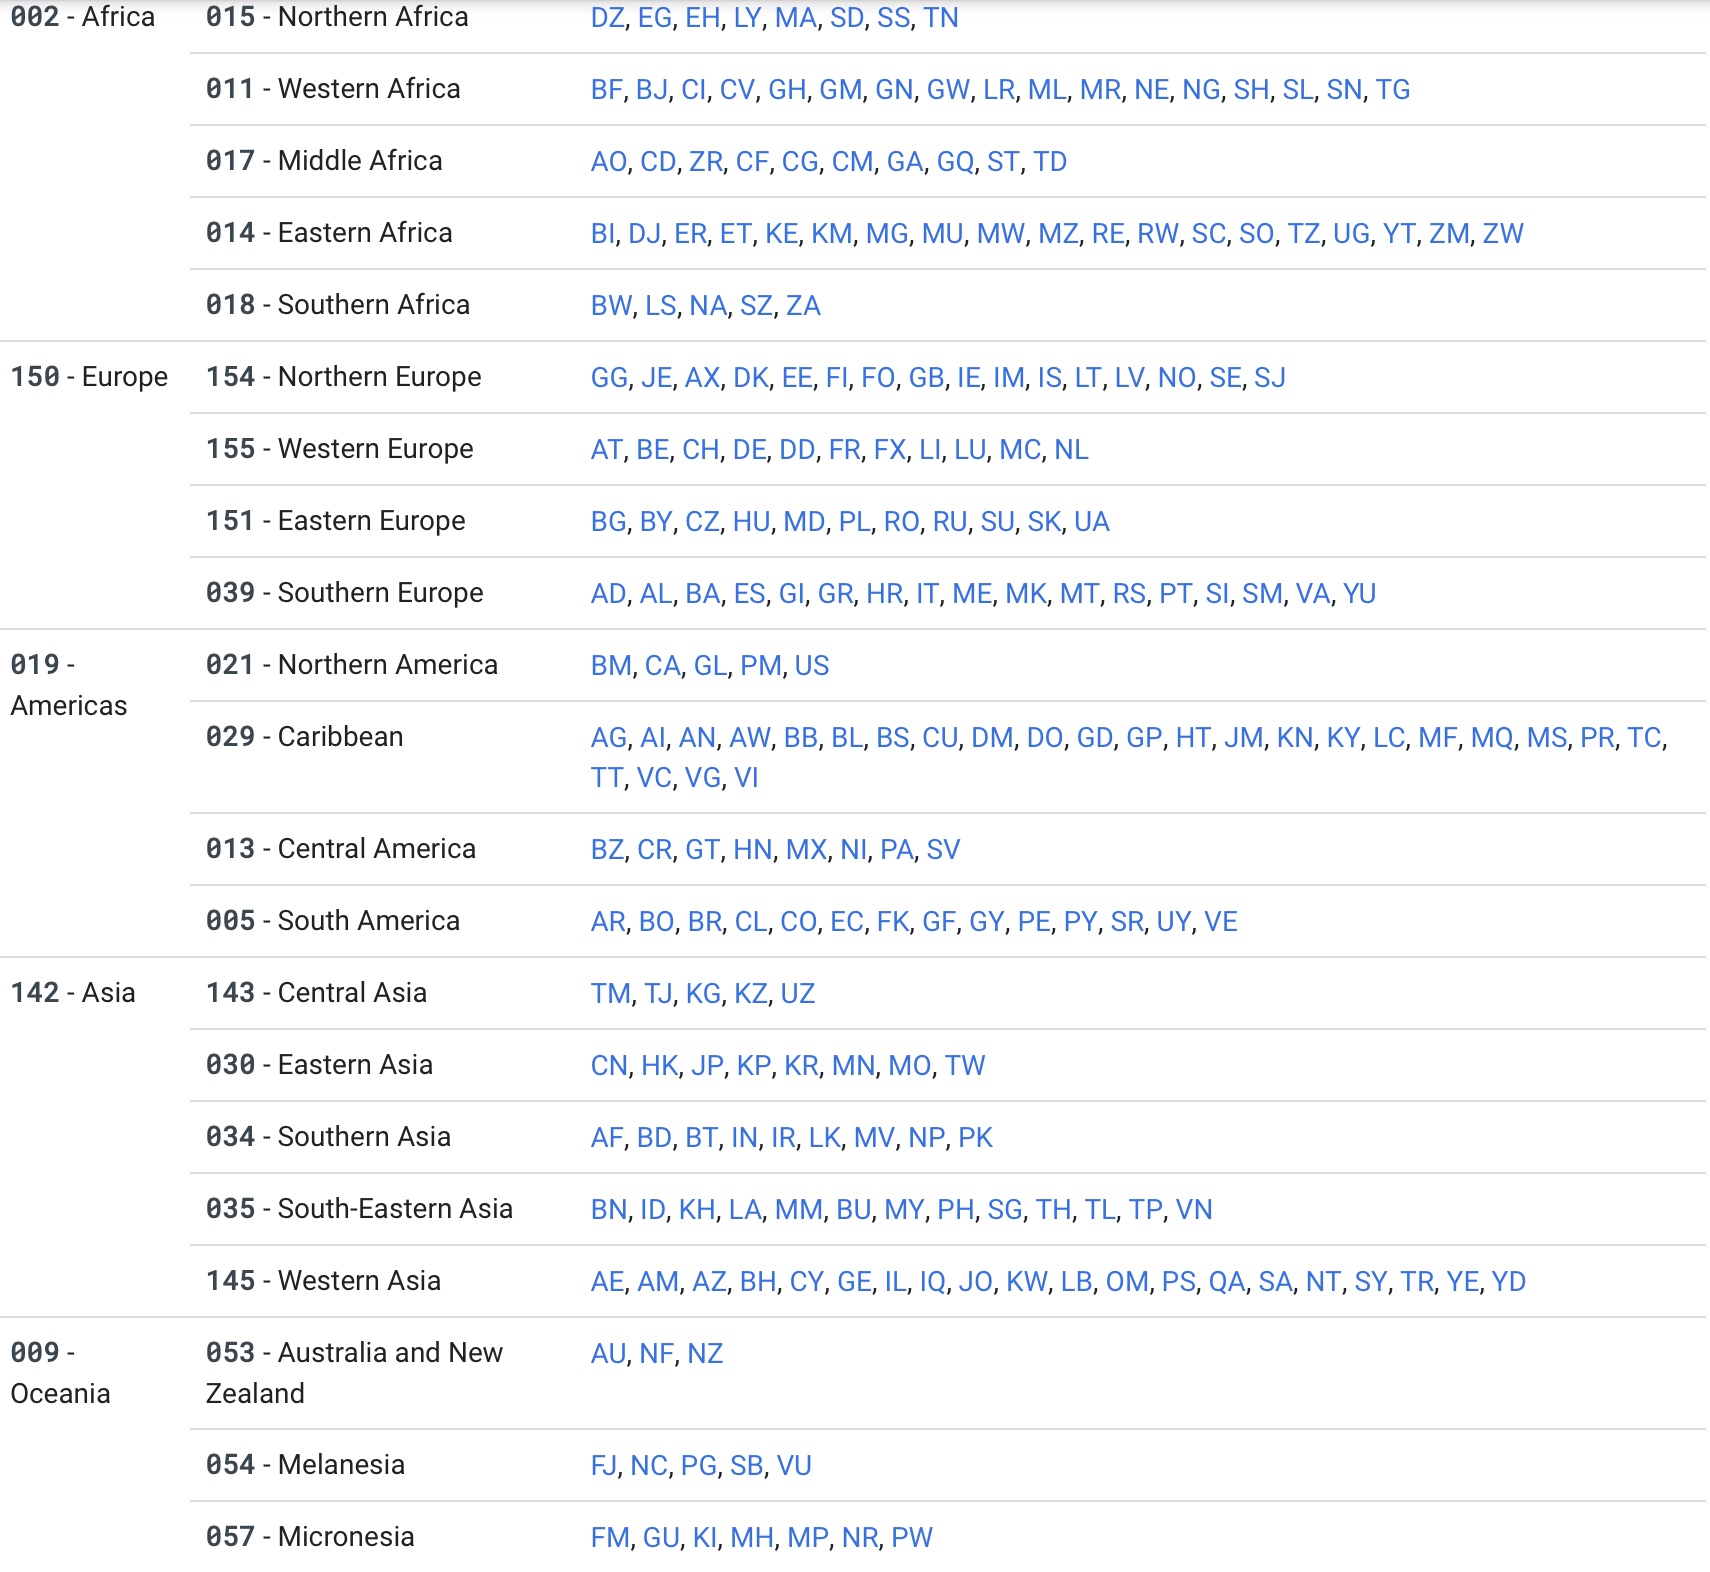
G1<-gvisGeoChart(Exports, locationvar="Country", colorvar="Profit")
plot(G1)
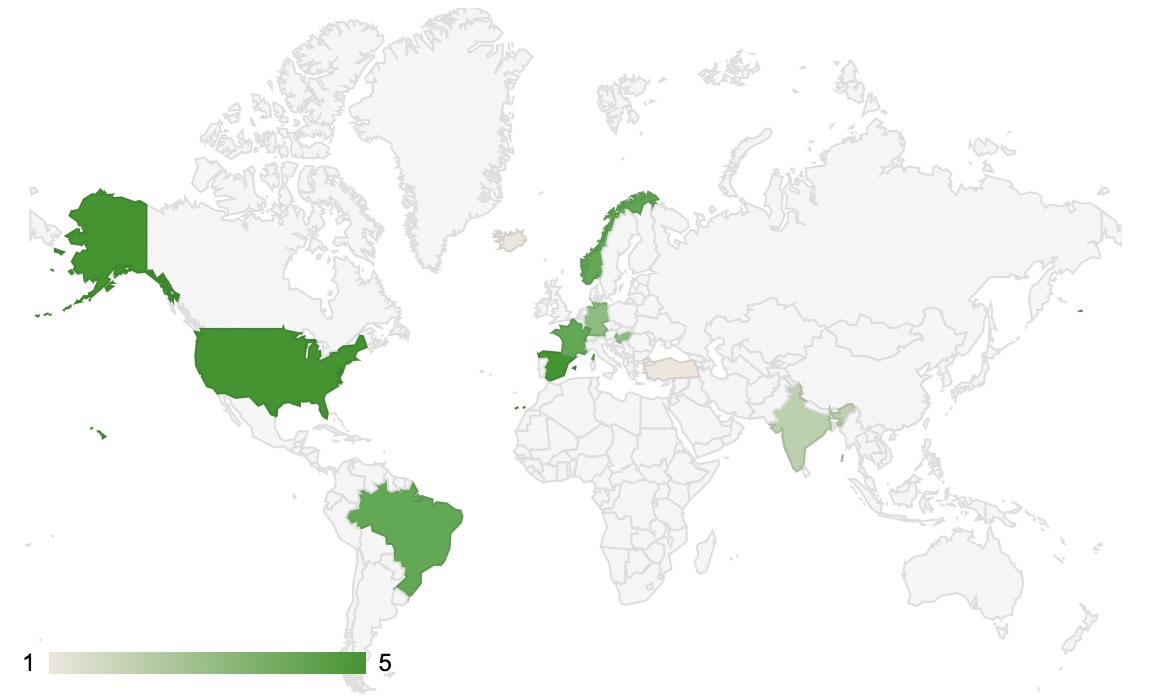
유럽(150)만 한정해서 그리기
G2<-gvisGeoChart(Exports, "Country", "Profit", options=list(region="150"))
plot(G2)
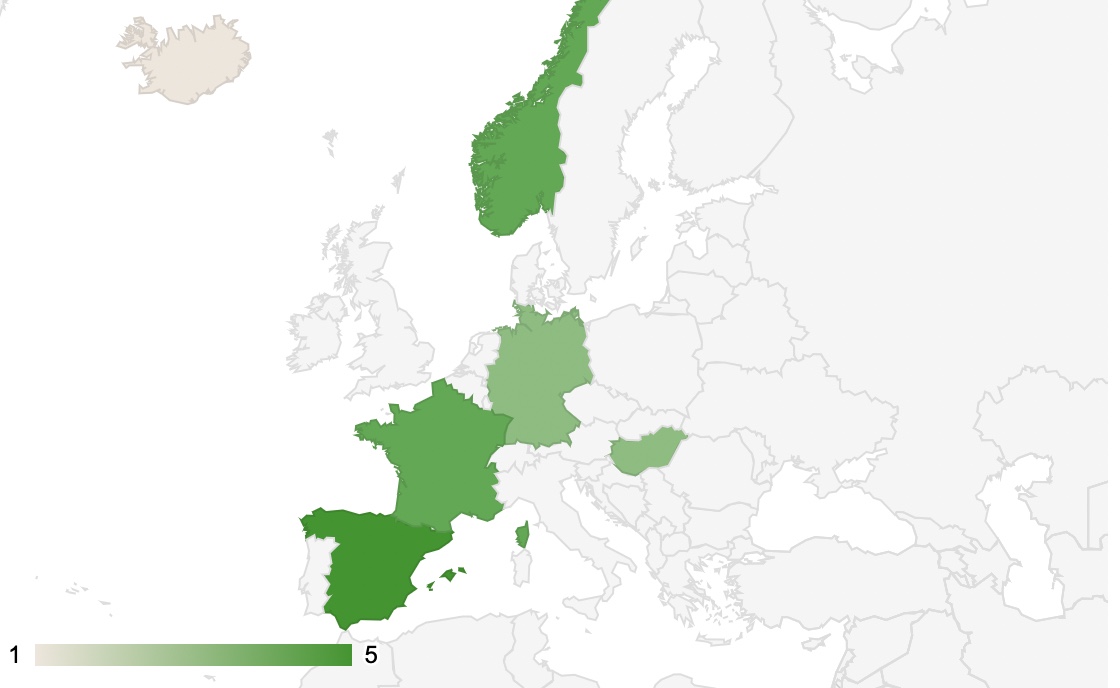
G3<-gvisGeoChart(states, "state.name", "Illiteracy", options=list(region="US", displayMode="regions", resolution="provinces", width=600, height=400))
plot(G3)
marker를 이용해서 지도에 표시
G4<-gvisGeoChart(CityPopularity, locationvar="City", colorvar="Popularity", options=list(region="US", height=350, displayMode="markers", colorAxis="{values:[200, 400, 600, 800], colors:[\'red', \'pink', \'orange', \'green']}"))
plot(G4) # marker 표시가 되지 않음
LatLong으로 위치 표기
Lat:Long(Latitude; 위도 : Longitude; 경도)
G5<-gvisGeoChart(Andrew, locationvar="LatLong", sizevar="Speed_kt", colorvar="Pressure_mb", option=list(region="US"))
plot(G5)

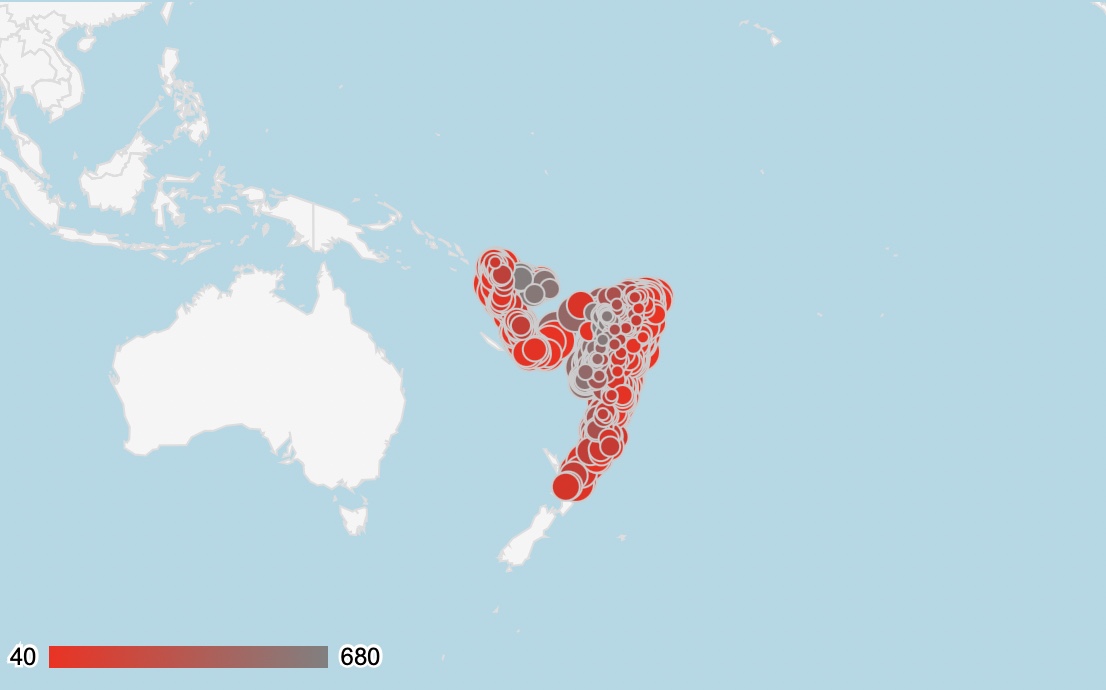
G7<-gvisGeoChart(quakes, "latlong", "depth", "mag", options=list(displayMode="Markers", region="009", colorAxis="{colors:['red', 'grey']}", backgroundColor="lightblue"))
plot(G7)
wikipedia 국가 신용도 정보(S&P)
library(XML)
url<-"https://en.wikipedia.org/wiki/List_of_countries_by_credit_rating"
x<-readHTMLTable(readLines(url), which=3, header=T)
x$Rating<-factor(x$Rating)
levels(x$Rating)<-substring(levels(x$Rating), 4, nchar(levels(x$Rating)))
x$Ranking<-x$Rating
levels(x$Ranking)<-nlevels(x$Rating):1
x$Ranking<-as.Character(x$Ranking)
x$Rating<-paste(x$Country, x$Rating, sep=": ")
G8<-gvisGeoChart(x, "Country/Region", "Ranking", hovervar="Rating", options=list(gvis.editor="S&P", colorAxis="{colors:['#91BFDB', '#FC8D59']}"))

earthquake(csv) 지진발생 정보
library(XML)
url<-"https://earthquake.usgs.gov/earthquakes/feed/v1.0/summary/2.5_day.csv"
eq<-read.csv(url)
eq$loc<-paste(eq$latitude, eq$longitude, sep=":")
G9<-gvisGeoChart(eq, "loc", colorvar="depth", sizevar="mag", options=list(displayMode="Markers", colorAxis="{colors:['purple', 'red', 'orange', 'grey']}", backgroundColor="lightblue"), chartid="EQ")
plot(G9)
