import numpy as np
import matplotlib.pyplot as plt
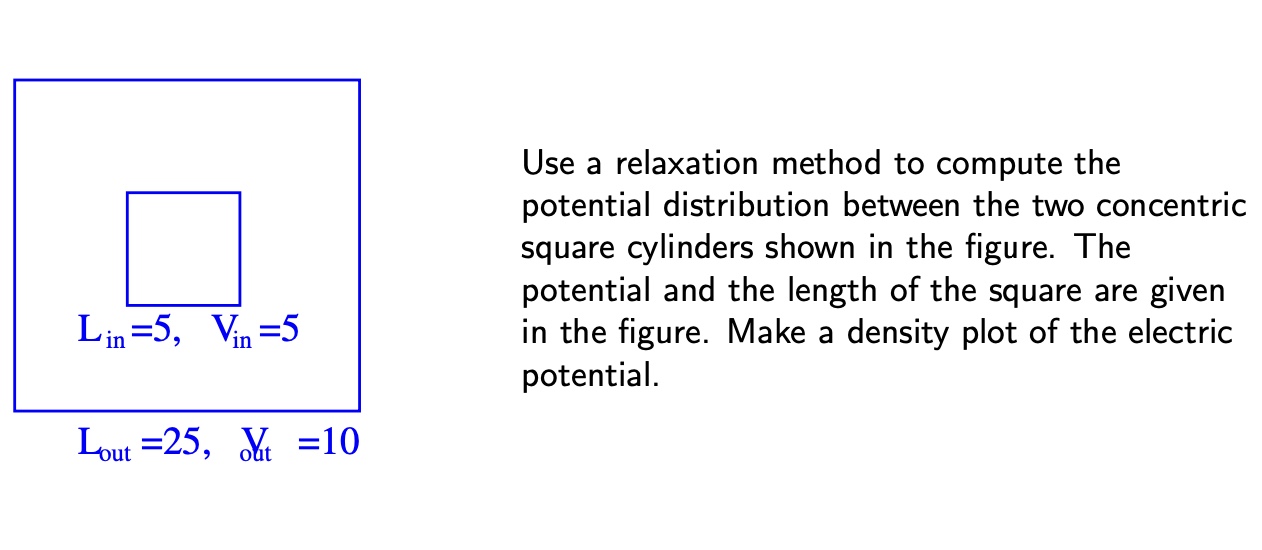
M=100
V=[5, 10]
tolarence=1.e-3
phi=np.zeros([M+1, M+1], float)
for i in range(40, 61):
for j in range(40, 61):
phi[i][j]=V[0]
for i in range(M):
phi[i, 0]=V[1]
phi[0, i]=V[1]
phi[i, -1]=V[1]
phi[-1, i]=V[1]
phitmp=np.copy(phi)
delta=1.
while delta>tolarence:
for i in range(1, M):
for j in range(1, M):
if not((40<i<60) and (40<j<60)) or (i==0 or i==100 or j==0 or j==100):
phitmp[i][j]=(phi[i+1][j]+phi[i-1][j]+phi[i, j-1]+phi[i, j+1])/4
delta=np.max(abs(phi-phitmp))
phi, phitmp=phitmp, phi
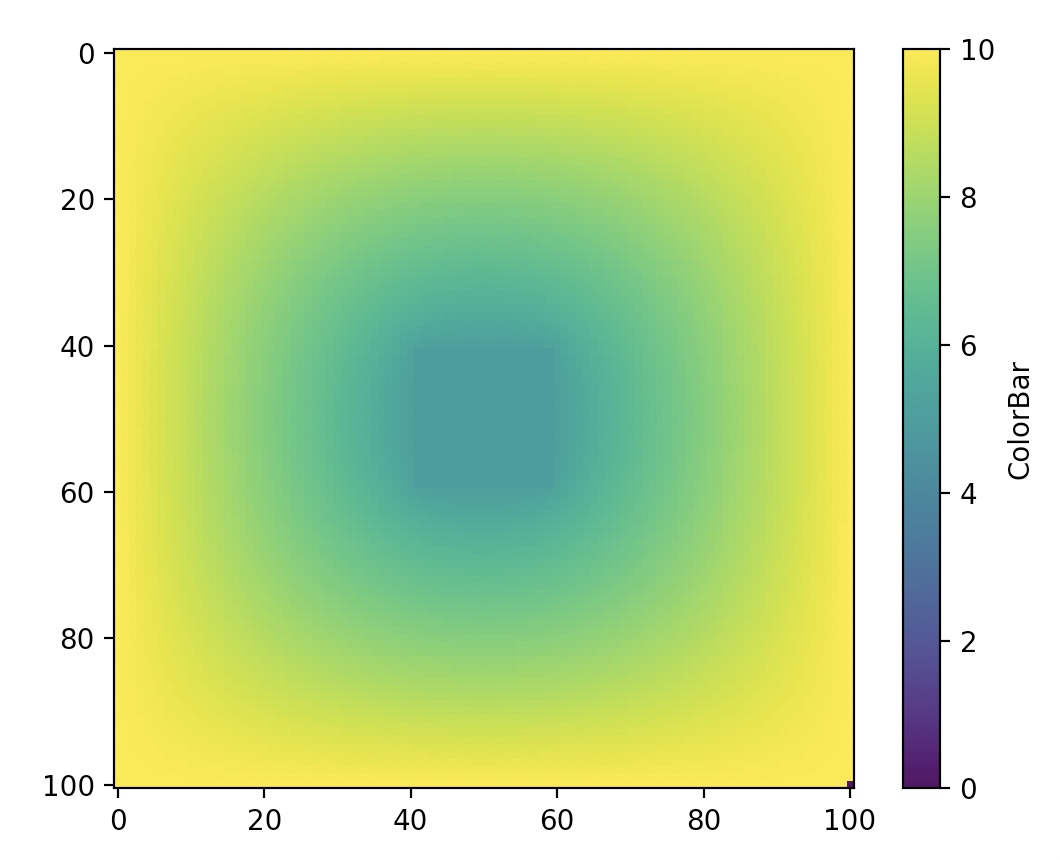
fig, ax=plt.subplots()
img=ax.imshow(phi)
side=plt.colorbar(img)
side.set_label("ColorBar")
plt.title("Voltage")
plt.show()
