ROC(Receiver Operating Characteristic)
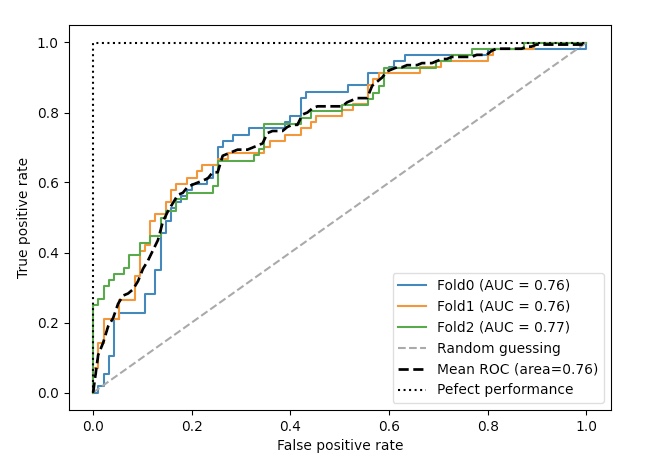
ROC 그래프는 분류기의 임계 값을 바꾸어 가며 계산된 FPR과 TPR 점수를 기반으로 분류 모델을 선택하는 유용한 도구이다.
ROC의 대각선은 랜덤 추측으로 해석할 수 있고, 대각선 아래 위치한 분류 모델은 랜덤 추측보다 나쁜 추측이다.
완벽한 분류기는 TPR이 1이고 FPR이 0인 왼쪽 위 구석에 위치한다.
ROC 아래 면적인 ROC AUC, Area Under the Curve)를 계산하여 분류 모델의 성능을 종합할 수 있다.
ROC 곡선과 유사하게 정밀도-재현율 곡선을 확률 임계 값에 대하여 그릴 수도 있다.
두개의 특성을 이용한 ROC 곡선
(두개의 특성만을 이용하기 때문에 과소적합으로 분류 작업이 어려워지므로 ROC 곡선이 시각적으로 잘 표현된다.)
from sklearn.metrics import roc_curve, auc
from numpy import interp
pipe_lr=make_pipeline(StandardScaler(), PCA(n_components=2), LogisticRegression(penalty='l2', random_state=1, C=100.0))
X_train2=X_train[:,[4, 14]]
cv=list(StratifiedKFold(n_splits=3, shuffle=True, random_state=1).split(X_train, y_train))
fig=plt.figure(figsize=(7,5))
mean_tpr=0.0
mean_fpr=np.linspace(0, 1, 100)
for i, (train, test) in enumerate(cv):
probas=pipe_lr.fit(X_train2[train], y_train[train]).predict_proba(X_train2[test])
fpr, tpr, thresholds=roc_curve(y_train[test], probas[:, 1], pos_label=1)
mean_tpr+=interp(mean_fpr, fpr, tpr)
mean_tpr[0]=0.0
roc_auc=auc(fpr, tpr)
plt.plot(fpr, tpr, label='ROC fold %d (area = %0.2f)'%(i+1, roc_auc))
plt.plot([0, 1], [0, 1], linestyle='--', color=(0.6, 0.6, 0.6), label='Random guessing')
mean_tpr/=len(cv)
mean_tpr[-1]=1.0
mean_auc=auc(mean_fpr, mean_tpr)
plt.plot(mean_fpr, mean_tpr, 'k-', label='Mean ROC (area=%0.2f)'%mean_auc, lw=2)
plt.plot([0, 0, 1], [0, 1, 1], linestyle=':', color='black', label='Perfect performance')
plt.xlabel('False positive rate')
plt.ylabel('True positive rate')
plt.legend(loc='lower right')
plt.tight_layout()
plt.show()

interp 함수를 이용하여 세 개의 폴드에 대한 ROC 곡선을 보간하여 평균을 구함
auc 함수를 이용하여 곡선 아래 면적을 계산
ROC AUC 점수에만 관심이 있다면, sklearn.metrics모듈의 roc_auc_score 함소를 사용할 수 있다.(precision_score 포함)
scikit-learn
plot_roc_curve() & plot_precision_recall_curve()
from sklearn.metrics import plot_roc_curve
fig, ax=plt.subplots(figsize=(7, 5))
mean_tpr=0.0
mean_fpr=np.linspace(0, 1, 100)
for i, (train, test) in enumerate(cv):
pipe_lr.fit(X_train2[train], y_train[train])
roc_disp=plot_roc_curve(pipe_lr, X_train2[test], y_train[test], name=f'Fold{i}', ax=ax)
mean_tpr+=interp(mean_fpr, roc_disp.fpr, roc_disp.tpr)
mean_tpr[0]=0.0
plt.plot([0, 1], [0, 1], linestyle='--', color=(0.6, 0.6, 0.6), label='Random guessing')
mean_tpr/=len(cv)
mean_tpr[-1]=1.0
mean_auc=auc(mean_fpr, mean_tpr)
plt.plot(mean_fpr, mean_tpr, 'k--', label='Mean ROC (area=%0.2f)' %mean_auc, lw=2)
plt.plot([0, 0, 1], [0, 1, 1], linestyle=':', color='black', label='Pefect performance')
plt.xlim([-0.05, 1.05])
plt.ylim([-0.05, 1.05])
plt.xlabel('False positive rate')
plt.ylabel('True positive rate')
plt.legend(loc="lower right")
plt.show()

위의 코드에서 plot_roc_curve() 함수를 plot_precision_recall_curve()로 바꾸고 자료 형태만 약간 수정하면
정밀도-재현율 곡선을 얻을 수 있다.
from sklearn.metrics import plot_precision_recall_curve
fig, ax=plt.subplots(figsize=(7, 5))
mean_precision=0.0
mean_recall=np.linspace(0, 1, 100)
for i, (train, test) in enumerate(cv):
pipe_lr.fit(X_train2[train], y_train[train])
pr_disp=plot_precision_recall_curve(pipe_lr, X_train2[test], y_train[test], name=f'Fold{i}', ax=ax)
mean_precision+=interp(mean_recall, pr_disp.recall[::-1], pr_disp.precision[::-1])
plt.plot([0, 1], [0, 1], linestyle='--', color=(0.6, 0.6, 0.6), label='Random guessing')
mean_precision/=len(cv)
mean_auc=auc(mean_recall, mean_precision)
plt.plot(mean_recall, mean_precision, 'k--', label='Mean ROC (area=%0.2f)' %mean_auc, lw=2)
plt.plot([0, 0, 1], [0, 1, 1], linestyle=':', color='black', label='Pefect performance')
plt.xlim([-0.05, 1.05])
plt.ylim([-0.05, 1.05])
plt.xlabel('False positive rate')
plt.ylabel('True positive rate')
plt.legend(loc="lower right")
plt.show()
